Visualisation
pyEMAPS provides a set of helper functions to show diffraction patterns. These function are implemented with python’s matplotlib.
si_dif.py and si_bloch.py sample code demonstrate the rendering of diffraction patterns generated for silicon crystal by plotting its kikuchi lines, diffracted beams and HOLZ lines for kinematic simulation and showing the raw image in the case of Bloch simulation.
Users can also access diffraction patterns data directly and visualize the pattern with third party tools such as ImageJ, DigitalMicrograph. as shown in Rendering by Third Party Tools
Builtin Displays
Kinematic Diffraction Simulations
Additional example of pyEMAPS’s builtin functions for rendering kinematic diffraction simulations for silicon crystal with starting zone changing and camera length set at 2500:

with the following sample code:
from pyemaps import DEF_CBED_DSIZE, DEF_MODE
from pyemaps import EMC

MAX_PROCWORKERS = 4

def generate_difs(name = 'Silicon', mode = DEF_MODE):

    from pyemaps import DPList
    import concurrent.futures
    from pyemaps import Crystal as cryst

    cr = cryst.from_builtin(name)

    if mode == 2:
        dsize = DEF_CBED_DSIZE

    zlist=[(0,0,1), (1,1,2), (1,1,1),
           (1,3,3), (0,1,2), (0,1,3)]

    fs=[]

    difs = DPList(name, mode = mode)

    emclist =[EMC(zone=z, cl=2500) for z in zlist]

    with concurrent.futures.ProcessPoolExecutor(max_workers=MAX_PROCWORKERS) as e:

        for ec in emclist:
            fs.append(e.submit(cr.generateDP, mode=mode,  dsize=dsize, em_controls = ec))

        for f in concurrent.futures.as_completed(fs):
            try:
                emc, diffP = f.result()
                difs.add(emc, diffP)

            except Exception as e:
                print(f'{f} generated an exception: {e}')
                exit(1)
    difs.sort()
    return difs

if __name__ == '__main__':

    from pyemaps import showDif

    dpl = generate_difs(mode = 2)
    showDif(dpl, cShow = True, iShow=True, layout='table', bSave = True)
Dynamic Diffraction Simulations
Below is another example of using pyEMAPS builtin display functions to render Bloch simulation images for silicon with:
zone=(1,1,1)
hight voltage vt=100
sample thickness = (500, 1750, 250)
(starting at 500, ending at 1750 with an increment of 250)
sampling points: 40

from pyemaps import EMC, DEF_CBED_DSIZE

MAX_PROCWORKERS = 4

def generate_bloch_images(name = 'Silicon', dsize = DEF_CBED_DSIZE, ckey = 'tilt'):

    from pyemaps import Crystal as cryst
    from pyemaps import SIMC

    cr = cryst.from_builtin(name)

    vt = 100
    sth = (500, 1750, 250)
    simc = SIMC(excitation=(0.3,1.0), bmin=0.1)

    try:
        bimgs = cr.generateBloch(sampling = 40,
                                em_controls = EMC(zone=(1,1,1),
                                vt=vt,
                                cl=1000,
                                simc=simc),
                                sample_thickness = sth
                                )
    except Exception as e:
            print(f'Generated an exception: {e}')
            return None

    bimgs.sort()
    return bimgs

if __name__ == '__main__':

    from pyemaps import showBloch

    imgs = generate_bloch_images()
    if imgs is not None:
        showBloch(imgs, cShow=True, layout='table', bSave = True)
Stereodiagram
Similar build-in function to display stereodiagram output from pyEMAPS is showStereo function in pyEMAPS’s display module. It takes a stereodiagram dictionary objects generated from pyEMAPS’ generateStereo and renders each element by accessing the dictionary objects directly as demonstrated below:
import concurrent.futures
from pyemaps import EMC
MAX_PROCWORKERS = 4

def getStereo(cc, emc = EMC()):

    stereo = cc.generateStereo(zone = emc.zone)
    return emc, stereo

def generate_stereo_list(name = 'Silicon'):
    from pyemaps import Crystal as cr

    si = cr.from_builtin(name)
    emclist = []

    for i in range(-3,3):
        emclist.append(EMC(zone=(i,-i,1)))

    fs = []
    slist=[]
    with concurrent.futures.ProcessPoolExecutor(max_workers=MAX_PROCWORKERS) as e:

        for ec in emclist:
            fs.append(e.submit(getStereo, si, emc=ec))

        for f in concurrent.futures.as_completed(fs):
            try:
                emc, stereo = f.result()
            except Exception as e:
                print('failed to generate stereodiagram with ' + str(e))
                exit(1)
            else:
                slist.append((emc, stereo))

    slist.sort(key=lambda x: x[0])
    return slist

if __name__ == '__main__':

    from pyemaps import showStereo

    stereoList = generate_stereo_list()
    showStereo(stereoList,
            name='Silicon',
            cShow = True,
            iShow=True,
            zLimit = 1,
            layout='table')

Pyemaps GUI Web Service
Driven by the latest pyEMAPS, a web server is setup for those who are interested in better visualization of pyEMAPS simulations and calculations. This service is for a nominal subscription fees. Go to https://emaps.emlabsolutions.com to sign up.
Below is an example of the ineractive 3-d display of atomic structure through Jmole based on pyEMAPS crystal structure calculations:

Rendering by Third Party Tools
pyEMAPS kinematic diffraction simulation results are captured by DP or diffPattern class:
from pyemaps import Crystal as cr

si = cr.from_builtin('Silicon')

_, dp = si.generateDP()

dp.klines   # Kikuchi lines list
dp.nklines  # number of Kikuchi lines, same as len(dp.klines)
dp.disks    # diffracted beams list
dp.ndisks   # number of diffracted beams, same as len(dp.disks)
dp.hlines   # HOLZ lines list
dp.nklines  # number of HOLZ lines, same as len(dp.hlines)
where dp.klines is a python list of Line class objects and dp.disks of Disk class objects and so on. Each of the objects is accessible for its own data such as points when plotting.
Below is an exmaple of rendering a diffraction pattern generated for Diamond builtin crystal in DigitalMicrograph:
Note
For complete python script integrating pyEMAPS into DM, see si_stereo.py in samples directory.
def show_diffract(dp, md=1, name = 'Diamond'):
    from pyemaps import XMAX, YMAX
    import DigitalMicrograph as DM

    shape = (2*XMAX*mult,2*YMAX*mult)

    #A new image from numpy array and initilize it to black background
    dif_raw = np.ones((shape), dtype = np.float32)
    dif_raw[:,:] = 255.0

    #DM create the image
    dm_dif_img = DM.CreateImage(dif_raw)
    dif_img = dm_dif_img.ShowImage()
    dif_img_disp = dm_dif_img.GetImageDisplay(0)

    #validate diffraction mode
    if md <1 or md > 2:
        print(f'diffraction mode provided {md} not supported')
        return 1

    #set image title
    img_title = str(f'Kinematic Diffraction Simulation:  {name} in {DIFF_MODE[md-1]} Mode')
    dm_dif_img.SetName(img_title)

    #plotting Kikuchi and HOLZ lines and spots as DM components
    num_klines = dp.nklines

    if num_klines > 0:
        klines = dp.klines
        for kl in klines:
            x1,y1,x2,y2, inten = kl #inten: intensity

            xx1, yy1, = (x1+ XMAX)*mult,(y1 + YMAX)*mult
            xx2, yy2  = (x2 + XMAX)*mult,(y2 + YMAX)*mult

            kline = dif_img_disp.AddNewComponent(2, xx1, yy1, xx2, yy2)

            SetCommonProp(kline)

            if inten/5 > 0.8:
                kline.SetForegroundColor(0.3, 0.3, 0.3) # dark grey
            elif inten/5 > 0.6:
                kline.SetForegroundColor(0.6, 0.6, 0.6)
            elif inten/5 > 0.4:
                kline.SetForegroundColor(0.8, 0.8, 0.8)
            else:
                kline.SetForegroundColor(0.9, 0.9, 0.9) # light grey
            kline.SetBackgroundColor(0.2,0.2,0.5)# dark blue

    num_disks = dp.ndisks

    if num_disks > 0:
        disks = dp.disks
        for d in disks:
            x1, y1, r, i1, i2, i3 = d
            xx, yy, rr = (x1 + XMAX)*mult, (y1 + YMAX)*mult, r*mult

            idx = '{:d} {:d} {:d}'.format(i1,i2,i3)

            disk = dif_img_disp.AddNewComponent(6, xx-rr, yy-rr, xx+rr, yy+rr)

            SetCommonProp(disk)
            disk.SetForegroundColor(0.0,0.0,1.0) # blue
            disk.SetBackgroundColor(0.5,0.5,0.75)# dark blue
            if md == 1:
                disk.SetFillMode(1)
            else:
                disk.SetFillMode(2)

            # a bit tricky to figure out the index location, has to use
            # the proxy component indxannot0 first.
            indxannot0 = DM.NewTextAnnotation(0, 0, idx, 10)

            t, l, b, r = indxannot0.GetRect()
            w = r-l
            h = b-t

            nl = xx - ( w / 2)
            # nr = xx + ( w / 2)
            nt = yy -rr - h if md ==1 else yy - (h / 2)
            # nb = yy + rr + h if md == 1 else yy + (h / 2)

            indxannot = DM.NewTextAnnotation(nl, nt, idx, 10)

            dif_img_disp.AddChildAtEnd(indxannot)
            SetCommonProp(indxannot)
            indxannot.SetForegroundColor(0.9,0,0) #light red
            indxannot.SetBackgroundColor(1,1,0.5)

    if md == 2:
        num_hlines = dp.nhlines

        if num_hlines > 0 :

            hlines = dp.hlines
            for hl in hlines:

                x1, y1, x2, y2, inten = hl
                xx1, yy1 = (x1 + XMAX)*mult, (y1 + YMAX)*mult
                xx2, yy2 = (x2 + XMAX)*mult, (y2 + YMAX)*mult

                hline = dif_img_disp.AddNewComponent(2, xx1, yy1, xx2, yy2)
                SetCommonProp(hline)

                if inten/5 > 0.8:
                    hline.SetForegroundColor(0.1,0.7,0.3) # dark grey
                elif inten/5 > 0.6:
                    hline.SetForegroundColor(0.1,0.7,0.6)
                elif inten/5 > 0.4:
                    hline.SetForegroundColor(0.1,0.7,0.8)
                else:
                    hline.SetForegroundColor(0.1,0.7,0.9) # light grey

    del dm_dif_img
    return 0
where dp is the kinematic diffraction pattern generated from generateDP call.
Note
To get the above display work in DM, pyEMAPS must be installed in DM’s python environment.
Dynamic Diffraction Patterns
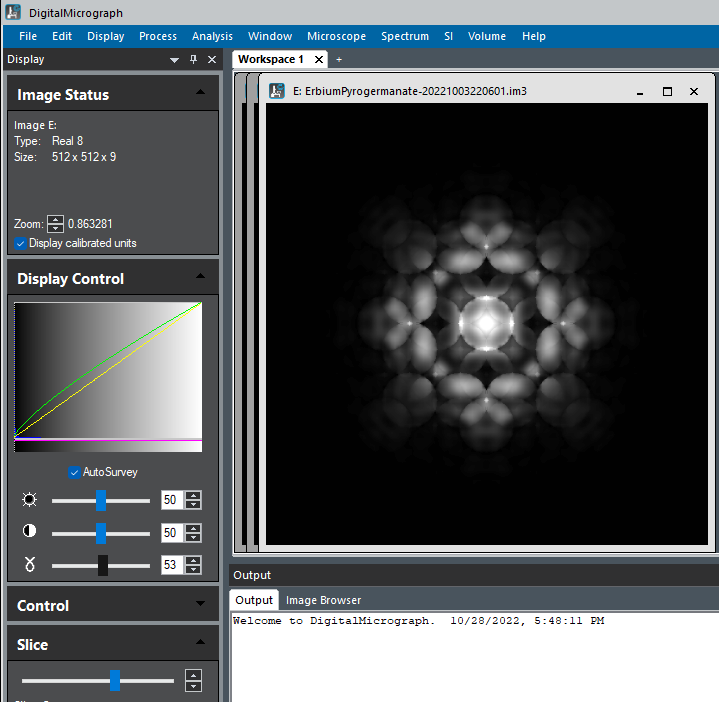
The output from bloch dynamic diffraction simulation is an array of 2 or 3 dimensional floating numbers representing image intensities, depending on whether one or multiple slices of dynamic diffraction images are generated.
pyEMAPS provides an option for users to save the images as raw image files that can be imported into ImageJ or DigitalMicrograph. Refer to generateBloch or getBlochImages for details.
Below is a visualization of a raw bloch images files saved from a pyEMAPS dynamic simulation run in Digita;Micrograph. The raw image contains 10 images each at a sample thickness range betwwen 0 and 1000.
Constructing Crystal
pyEMAPS’ generateMxtal function produces .XYZ file that can be improted into Jmole and visualize the crystal in 3D atomic structure. The following is an example of such rendering:
