Stereodiagrams#
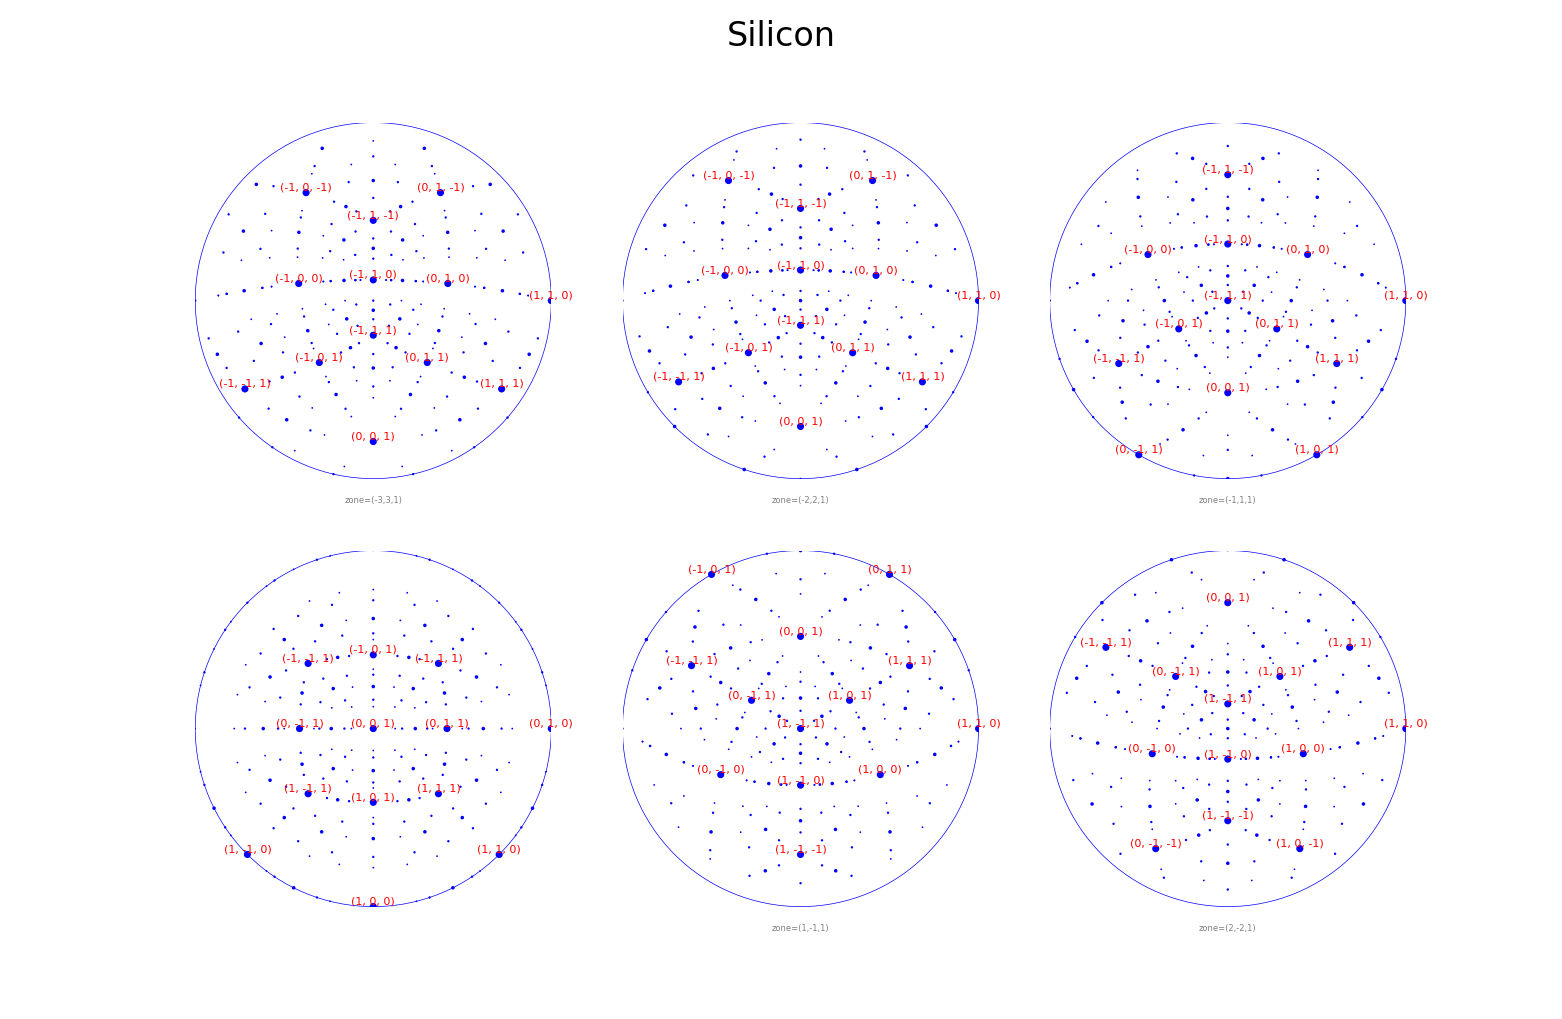
generateStereo() calculates a crystal’s stereodiagram: the
projected poles, each a dictionary with its center, radius and Miller indices.
showStereo(), from the display module,
draws a list of stereodiagrams.
This example makes Silicon stereodiagrams at six zone axes, in parallel processes, and shows them as a table:
import concurrent.futures
import sys

from pyemaps import EMC, Crystal, showStereo

MAX_WORKERS = 4    # number of parallel processes


def stereodiagram(crystal, emc):
    """Return `emc` and the crystal's stereodiagram at the zone axis in `emc`."""
    return emc, crystal.generateStereo(zone=emc.zone)


def generate_stereodiagrams(name='Silicon'):
    """Generate stereodiagrams at six zone axes, in parallel."""
    crystal = Crystal.from_builtin(name)
    emc_list = [EMC(zone=(i, -i, 1)) for i in range(-3, 3)]

    stereo_list = []
    with concurrent.futures.ProcessPoolExecutor(max_workers=MAX_WORKERS) as executor:
        futures = [executor.submit(stereodiagram, crystal, emc) for emc in emc_list]

        for future in concurrent.futures.as_completed(futures):
            try:
                stereo_list.append(future.result())
            except Exception as e:
                sys.exit(f'Failed to generate a stereodiagram: {e}')

    stereo_list.sort(key=lambda pair: pair[0])    # sort by the microscope controls
    return stereo_list


if __name__ == '__main__':
    showStereo(generate_stereodiagrams(), name='Silicon',
               cShow=True, iShow=True, zLimit=1, layout='table')