Using results in other tools#
Kinematic diffraction patterns#
generateDP() returns the kinematic diffraction pattern as a
diffPattern, whose parts you can read directly:
from pyemaps import Crystal

silicon = Crystal.from_builtin('Silicon')
_, pattern = silicon.generateDP()

pattern.klines     # the Kikuchi lines
pattern.nklines    # the number of Kikuchi lines, same as len(pattern.klines)
pattern.disks      # the diffracted beams
pattern.ndisks     # the number of diffracted beams, same as len(pattern.disks)
pattern.hlines     # the HOLZ lines
pattern.nhlines    # the number of HOLZ lines, same as len(pattern.hlines)
pattern.klines and pattern.hlines are lists of Line objects,
and pattern.disks is a list of:py:class:~pyemaps.kdiffs.Disk objects. A line unpacks to its end
points and intensity, x1, y1, x2, y2, intensity, and a disk to its center, radius and Miller
indices, x, y, r, h, k, l, ready for plotting in other tools.
The functions below draw a kinematic diffraction pattern in DigitalMicrograph (DM). They’re
from the dm_diff.py sample, which has the complete script: it imports numpy as np and
DigitalMicrograph as DM, and defines the constants and the small helpers to_image, lock
and line_color that these functions use. pyemaps -cp samples copies the samples into a
pyemaps_samples folder.
def draw_lines(display, lines, colors, background=None):
    """Draw Kikuchi or HOLZ lines, each colored by its intensity."""
    for x1, y1, x2, y2, intensity in lines:
        line = display.AddNewComponent(LINE, *to_image(x1, y1), *to_image(x2, y2))
        lock(line)
        line.SetForegroundColor(*line_color(intensity, colors))
        if background is not None:
            line.SetBackgroundColor(*background)


def draw_disks(display, disks, mode):
    """Draw the diffracted beams as disks, each labeled with its Miller indices."""
    for x, y, r, h, k, l in disks:
        cx, cy = to_image(x, y)
        radius = r * SCALE

        disk = display.AddNewComponent(OVAL, cx - radius, cy - radius, cx + radius, cy + radius)
        lock(disk)
        disk.SetForegroundColor(0.0, 0.0, 1.0)     # blue
        disk.SetBackgroundColor(0.5, 0.5, 0.75)    # light blue
        disk.SetFillMode(1 if mode == NORMAL else 2)

        # The label goes above the disk in normal mode, and on its center in CBED mode.
        # Measure the label's size with a throwaway annotation first.
        text = f'{h} {k} {l}'
        top, left, bottom, right = DM.NewTextAnnotation(0, 0, text, 10).GetRect()
        width, height = right - left, bottom - top

        label_left = cx - width / 2
        label_top = cy - radius - height if mode == NORMAL else cy - height / 2
        label = DM.NewTextAnnotation(label_left, label_top, text, 10)
        display.AddChildAtEnd(label)
        lock(label)
        label.SetForegroundColor(0.9, 0.0, 0.0)    # red
        label.SetBackgroundColor(1.0, 1.0, 0.5)    # light yellow


def show_pattern(pattern, mode=NORMAL, name='Diamond'):
    """Draw a kinematic diffraction pattern in a new DM image.

    :param pattern: a kinematic diffraction pattern from Crystal.generateDP.
    :param mode: the pattern's diffraction mode, NORMAL or CBED.
    :param name: the crystal name, for the image title.
    :return: 0 on success, 1 for an unsupported mode.
    """
    if mode not in MODE_NAMES:
        print(f'Diffraction mode {mode} is not supported')
        return 1

    # A new DM image with a white background.
    shape = (2 * XMAX * SCALE, 2 * YMAX * SCALE)
    image = DM.CreateImage(np.full(shape, 255.0, dtype=np.float32))
    image.ShowImage()
    image.SetName(f'Kinematic Diffraction Simulation: {name} in {MODE_NAMES[mode]} Mode')

    display = image.GetImageDisplay(0)
    draw_lines(display, pattern.klines, KIKUCHI_COLORS, background=(0.2, 0.2, 0.5))
    draw_disks(display, pattern.disks, mode)
    if mode == CBED:
        draw_lines(display, pattern.hlines, HOLZ_COLORS)

    # Release the Python reference to the image; DM keeps showing it.
    del image
    return 0
where pattern is a kinematic diffraction pattern from generateDP.
Note
To run this in DM, pyEMAPS must be installed in DM’s Python environment, and that Python must be a version pyEMAPS supports (3.12 to 3.15).
Dynamic diffraction images#
generateBloch() returns a
BImgList with one image per sample thickness: each entry
is the controls used and the image, a 2-D float32 NumPy array (512 × 512 pixels by default).
With bSave=True, generateBloch() and
getBlochImages() also save the images in a raw image file that
ImageJ or DigitalMicrograph can import.
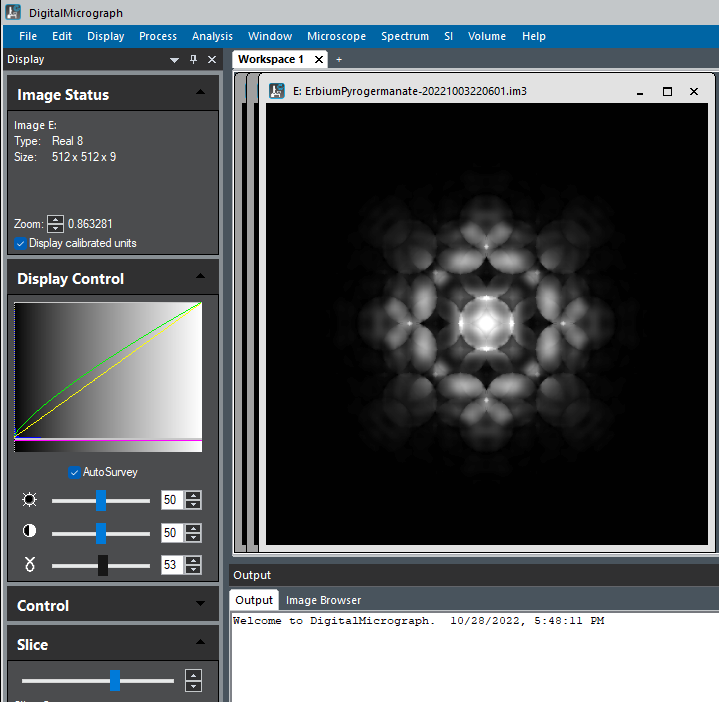
Here are the images in a raw file from a pyEMAPS dynamic simulation, shown in DigitalMicrograph. The file holds 10 images, at sample thicknesses from 0 to 1000 Å.